Palette updates: a full day with three people, down to 30 seconds with one.
At LexisNexis Risk Solutions, Figma, Storybook, and production code spoke different languages. I ran the research, built the prototypes, and helped ship the pipeline that connects them: 180+ WCAG-tested tokens across two design systems, one source of truth. It starts with naming: every foundation swatch maps to a semantic alias.
Foundations become semantic aliases: the name is the contract.
Two design systems. Zero shared language.
LexisNexis runs ThreatMetrix, fraud detection for financial institutions worldwide. A palette update took one designer and two UX engineers hand-translating values into Storybook and CSS.
And the fraud analysts using the product daily had never been interviewed.
Eight interviews that rewrote the roadmap.
Custom Layouts was on the roadmap, but nobody had defined what "custom" meant. I joined client calls and tagged 8 interviews in Dovetail.
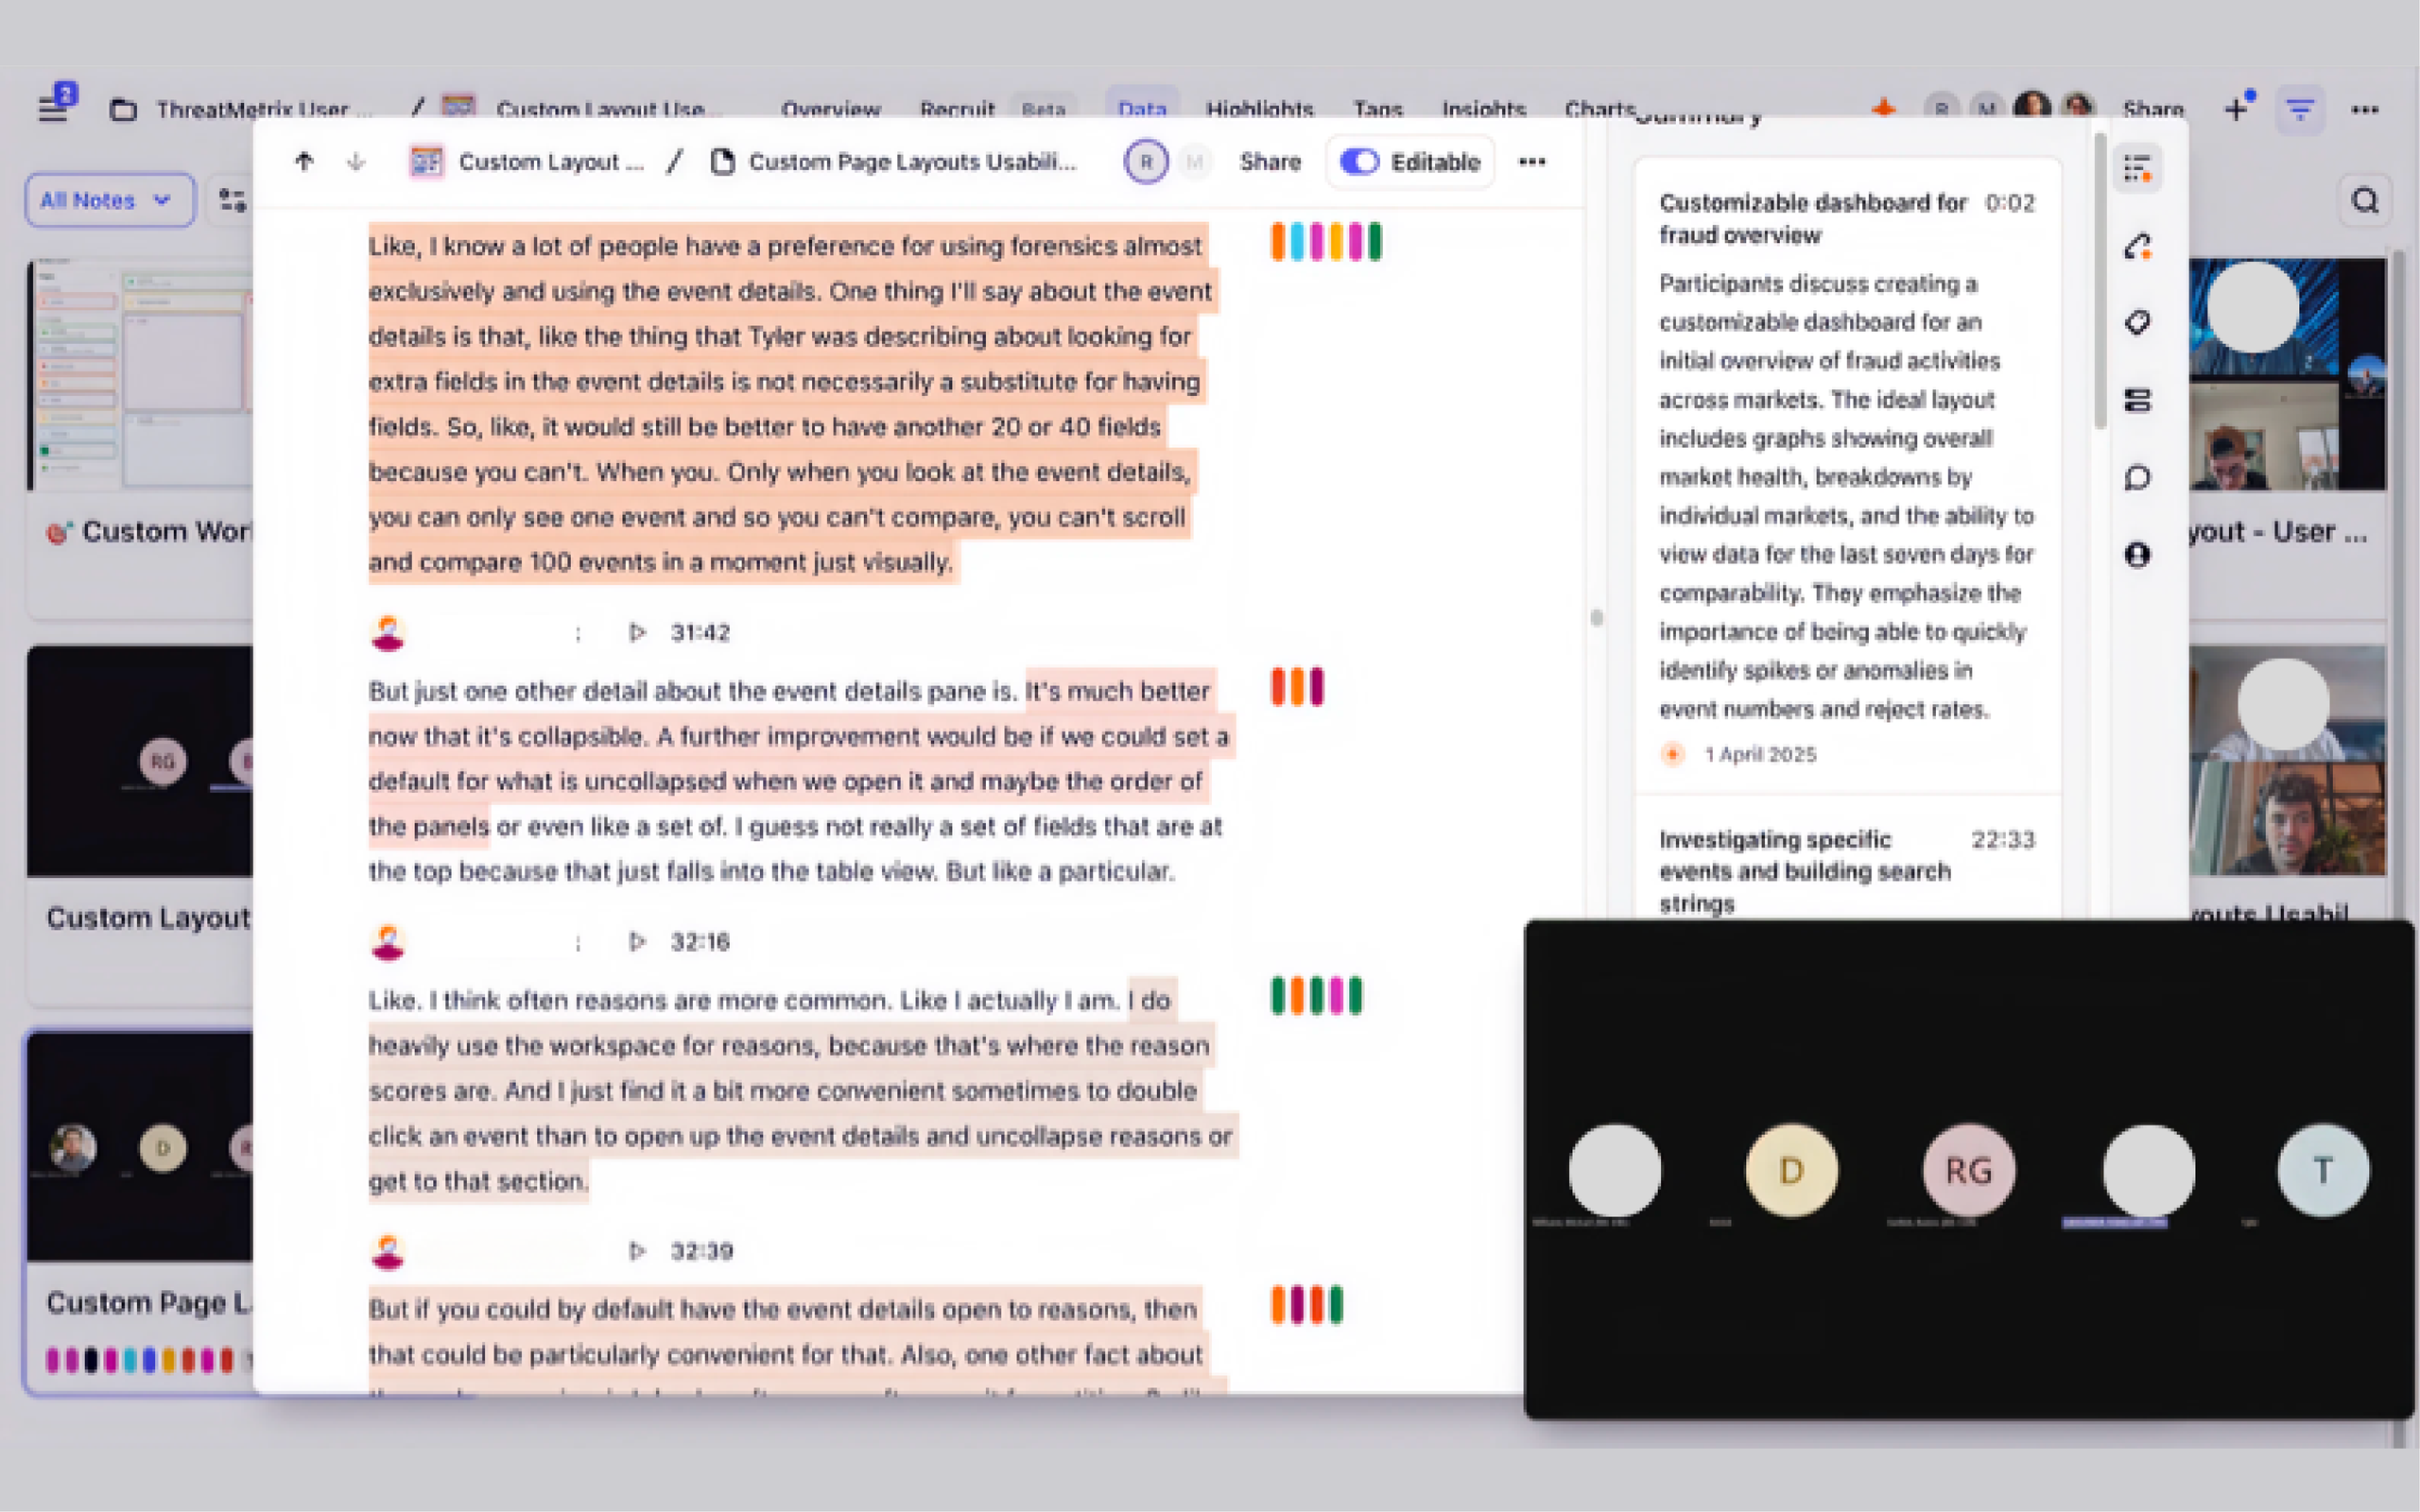
Analysts monitor dozens of signals, but the dashboard forces one fixed layout. Every insight went into a three-dimension taxonomy so counts could answer roadmap questions.
Every insight lands in a taxonomy: counts become the roadmap.
The skill that stuck: writing insights specific enough that a PM could build a ticket from them.
Three rounds in two weeks.
I built an interactive Figma prototype of drag-and-drop dashboard customization. Each round of moderated testing, I fixed what made analysts hesitate and shipped before the next session.
By the third round, analysts completed tasks without guidance. The core interaction, rebuilt:
Try it: pick a widget, add it to the layout.
One source of truth for two design systems.
I built a Figma token library: 180+ colors, each WCAG-tested, each named for usage, not appearance. "Surface-elevated" and "feedback-error" replaced "gray-200" and "red-3."
With a UX engineer, I defined the JSON schema so token names, nesting, and values survive the trip from Figma to code untouched.
Infrastructure that outlasts the project.
Palette updates: full day → 30 seconds. What required 3 people and a coordinated handoff now takes 1 designer.
180+ WCAG-tested tokens serving 2 design systems through a shared architecture.
8 user interviews that directly shaped the Custom Layouts product roadmap.
The token pipeline became the foundation for the 2025 design system rollout across LexisNexis Risk Solutions. Before and after:
Six manual handoffs become one automated export.